
Property Auction Insights
March 2025
As we look back on 2024, the UK property auction market has demonstrated resilience and growth, with notable increases in sales volumes, total funds raised, and investor engagement. Against the backdrop of shifting economic conditions and regulatory changes, auctions have remained a key avenue for buyers and sellers seeking efficiency, transparency, and competitive pricing.
This report provides a comprehensive review of the auction landscape throughout 2024, examining trends in property yields, investor activity, and the rising prominence of unmodernised properties. With data-driven insights, we highlight key regional movements, sector-specific shifts, and the factors that shaped the market over the past year, offering valuable takeaways for those looking to navigate the auction space in 2025 and beyond.
Focus On: 2024 | Year in Review
The auction market saw impressive growth in 2024, with increases in lots sold, total funds raised, and average sale prices. The data highlights a robust and expanding market, with rising demand and higher property values compared to 2023. While there were minor fluctuations throughout the year, the overall trend points to heightened investor confidence and a competitive auction environment.
The number of lots sold rose from 25,375 in 2023 to 28,063 in 2024, marking a 10.6% increase. February and September remained the busiest months, with 3,250 and 3,302 lots sold respectively. While most months experienced growth, August and November recorded slight declines compared to the previous year.
Total funds raised also saw substantial gains, increasing from £4.83 billion in 2023 to £5.5 billion in 2024 - a 13.9% rise. June, July, and September stood out, with June surging from £310 million to £431 million - a 39% jump, marking one of the year's most significant increases. July followed, rising from £431 million to £611 million, while September recorded the highest total raised at £700 million, reinforcing strong investor activity.
Average sale prices continued to climb, increasing from £190,315 in 2023 to £195,969 in 2024, reflecting appreciation in property values and heightened competition among buyers. Notably, January, June, and November saw the most significant price increases. The fact that prices remained resilient despite fluctuations in lots sold and total funds raised further underscores the market's stability.
Annual Comparison 2023 to 2024
Overall, 2024 was a year of growth, with more properties sold at higher prices and greater total funds raised. While certain months showed minor dips, the overarching trend was positive, pointing to sustained demand and a highly competitive auction landscape. With rising average sale prices and increased investor confidence, the market remains an attractive space for buyers and sellers alike.
Lots Sold
Total Raised
Average Sale Price
Focus On: Property Yields in 2024
The 2024 auction market for tenanted and investment properties experienced notable fluctuations in sale prices and yields across the residential, commercial, and mixed-use sectors. Investors responded dynamically to shifting economic conditions, financing costs, and tenant demand, shaping a year of price movements and risk assessments.
National Overview
The residential investment market experienced price volatility, with an initial dip in Q1 followed by a recovery and subsequent stabilisation. Yields remained strong, peaking at 8.85% early in the year and holding firm above 8%, indicating that investors continued to pursue solid returns despite shifting property values.
Commercial property values exhibited significant swings, with strong investor confidence in the first and final quarters but a mid-year decline likely influenced by concerns over tenant stability and broader market conditions. Yields followed a similar trajectory, peaking at 11.85% early in the year, dipping mid-year, and recovering to 11.12% in Q4.
Mixed-use properties demonstrated relative stability, though prices softened toward the year's end. Yields remained within the 6.95%-7.74% range, with minor fluctuations suggesting shifts in investor sentiment. The resilience of mixed-use assets suggests their diversified income streams helped sustain demand amid broader market fluctuations.
Overall, 2024 was a year of price adjustments and recalibrated investor expectations. Residential properties maintained strong yields despite valuation shifts, while commercial properties saw more pronounced changes reflecting economic uncertainty. As we move into 2025, attention will remain on tenant security, interest rates, and evolving investor appetite for different property types.
Regional Analysis
Regional Regional data revealed notable shifts in investment property yields across the UK. Scotland stood out with a 17.3% yield after a significant 4.0 percentage point increase.
The North-East (14.5%) and East Anglia (12.7%) also performed well, rising by 3.6 and 3.8 percentage points, respectively, highlighting increased investor interest in these areas. Yorkshire (12.3%) recorded a 1.4 percentage point increase, maintaining a solid yield. In contrast, London remained the lowest-yielding region at 6.3%, with minimal movement (+0.1 percentage points), reinforcing its position as a lower-yield but historically stable market.
Some regions experienced declining yields, most notably Northern Ireland, which dropped by 5.1 percentage points to 7.8%, suggesting weaker rental performance or property values outpacing rents. The North-West (9.8%) and Wales (11.4%) also saw contractions of 2.1 and 2.6 percentage points, respectively. Meanwhile, the South-East (8.2%) and South-West (9.7%) recorded moderate increases, maintaining steady investor interest. The data suggests that investors continue to focus on high-yield, lower-cost regions, while established markets like London and the South-East remain stable but less lucrative in terms of yield.
| Region Name | Average Sale Price | Yield | Change |
|---|---|---|---|
| East Anglia | £280,451 | 12.7% | 3.8% |
| East Midlands | £289,950 | 9.5% | 0.5% |
| London | £583,143 | 6.3% | 0.1% |
| North-East | £78,468 | 14.5% | 3.6% |
| Northern Ireland | £108,125 | 7.8% | -5.1% |
| North-West | £151,302 | 9.8% | -2.1% |
| North-West Home Counties | £447,803 | 7.1% | 0.4% |
| Scotland | £296,724 | 17.3% | 4.0% |
| South-East Home Counties | £407,928 | 8.2% | 0.7% |
| South-West | £366,920 | 9.7% | 0.8% |
| Wales | £201,706 | 11.4% | -2.6% |
| West Midlands | £223,701 | 9.7% | -0.2% |
| Yorkshire and The Humber | £164,527 | 12.3% | 1.4% |
For the full regional breakdown and analysis for the past five years, please see the Regional Data section towards the end of the page.
Focus on: Unmodernised Properties
Unmodernised properties are always a big draw at auction, and if you've ever watched Homes Under the Hammer, you'll know why. They offer buyers the chance to add value, whether that's through a full renovation, modernisation, or simply a bit of cosmetic work. For developers, it's all about maximising profit, while first-time buyers see it as an opportunity to get on the property ladder at a lower price and improve their home over time. It's easy to assume that most auction properties fall into this category, but while they make up a significant chunk of the market, they're far from the only type available.
A common misconception is that auction properties are all run-down and in need of serious work, but in reality, unmodernised homes account for around 30% of the total auction market. Plenty of properties going under the hammer are already modernised, tenanted, or sold for reasons such as repossessions, investment portfolios, or simply because the seller wants a quick and secure sale. That being said, unmodernised homes remain a big part of the auction world because they give buyers the potential to add value and increase returns.
What exactly does "unmodernised" mean? In most cases (around 97%), it simply refers to a vacant property that needs updating - perhaps a new kitchen, bathroom, or even just a fresh coat of paint. A much smaller proportion (1%) includes properties with more serious issues, such as fire or flood damage or structural problems, which require extensive work. Then there are tenanted properties (2%) being sold to landlords, which will likely need renovation in the future when tenants eventually move out. The data that follows looks at just how prominent unmodernised properties are at auction and what types tend to appear most often. For anyone looking to take on a project, understanding what's out there - and where the best opportunities lie - is key to making the most of the auction market.
Market Share
Unmodernised homes have grown their market share significantly, reaching 29.9% in 2024 - the highest level in five years. With the Renters Reform Act set to take effect in 2025 and stricter EPC regulations making it harder to let energy-inefficient homes, many landlords may be opting to offload properties rather than invest in costly upgrades. This trend has led to a growing supply of refurbishment opportunities, with buyers stepping in to capitalise on value-add projects.
Residential
2024
Property Types
While the overall number of properties coming to auction has grown, terraced and semi-detached houses have led the way in the rise of unmodernised lots, standing out as the most common types in this category. Terraced homes, in particular, surged, with 932 sold in Q1 2024 alone. Semi-detached houses also saw strong demand, peaking at 498 in Q3 2024. Flats and apartments followed a similar upward trajectory, reflecting increasing refurbishment opportunities. Meanwhile, detached houses, bungalows, and mixed-use properties experienced more modest growth, indicating a continued focus on accessible properties with strong renovation potential.
Real-Life Case Studies: From Auction to Resale
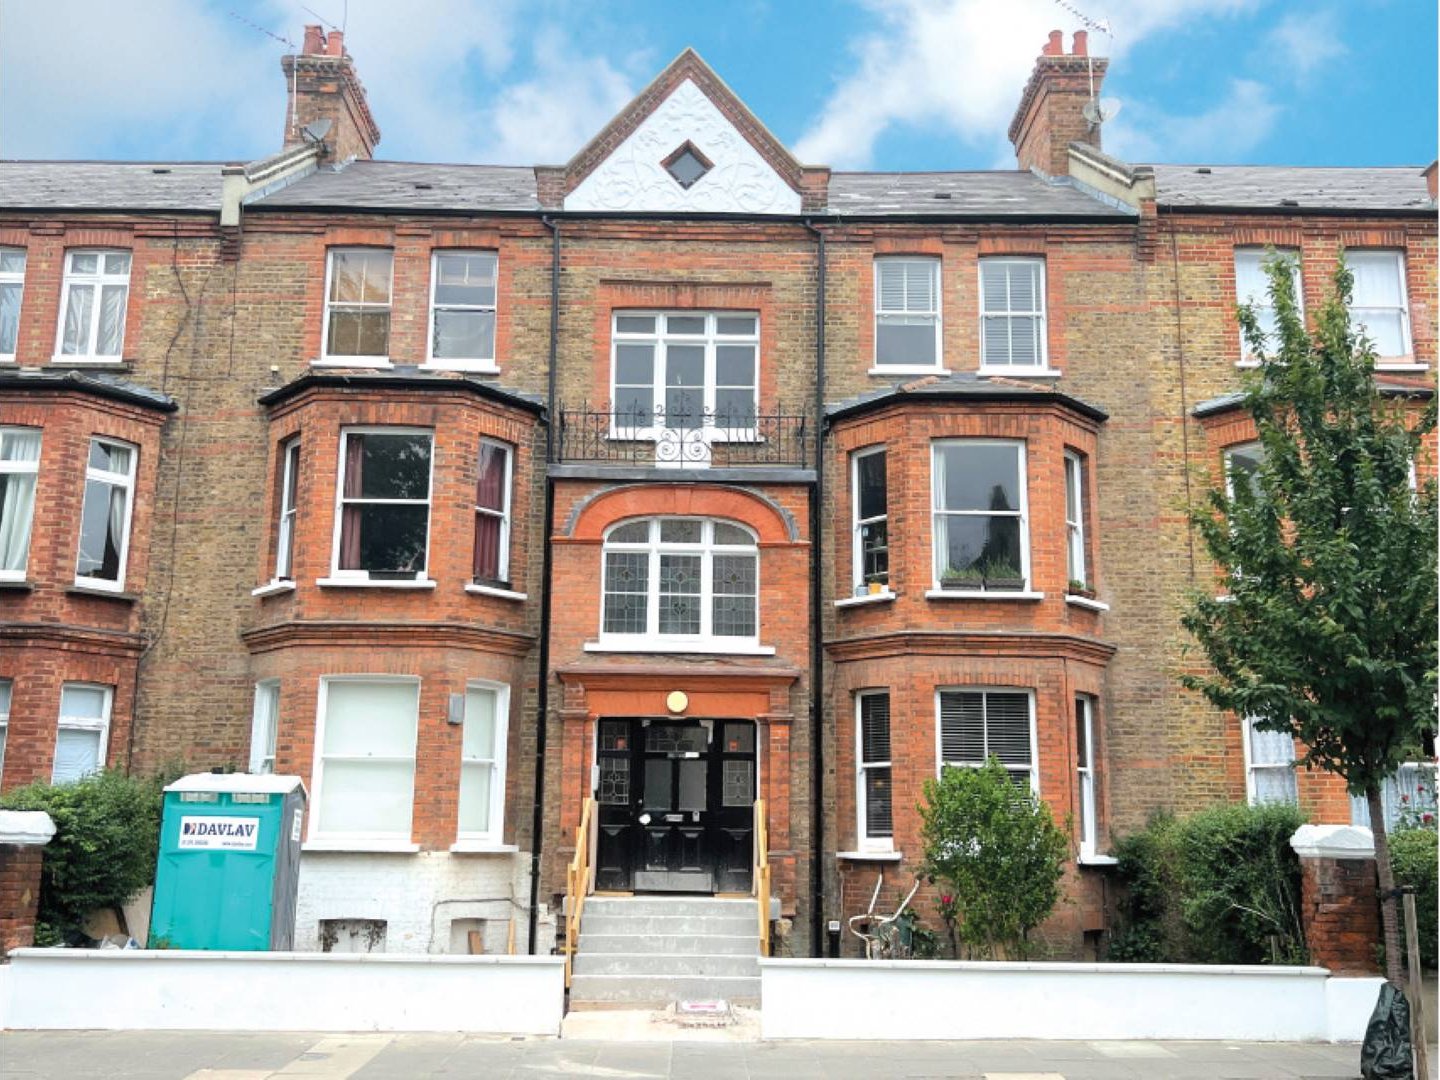
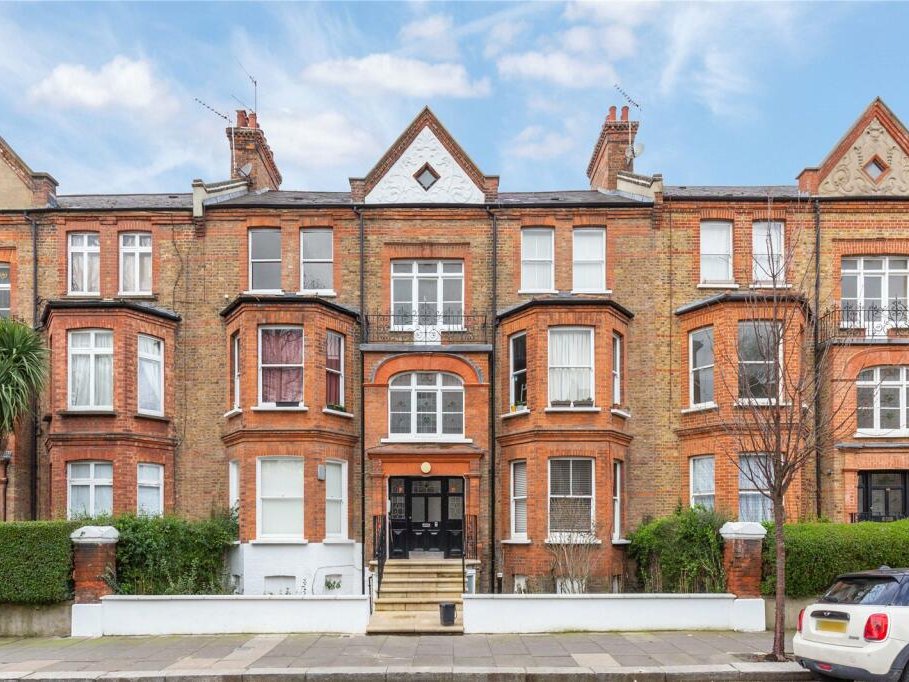
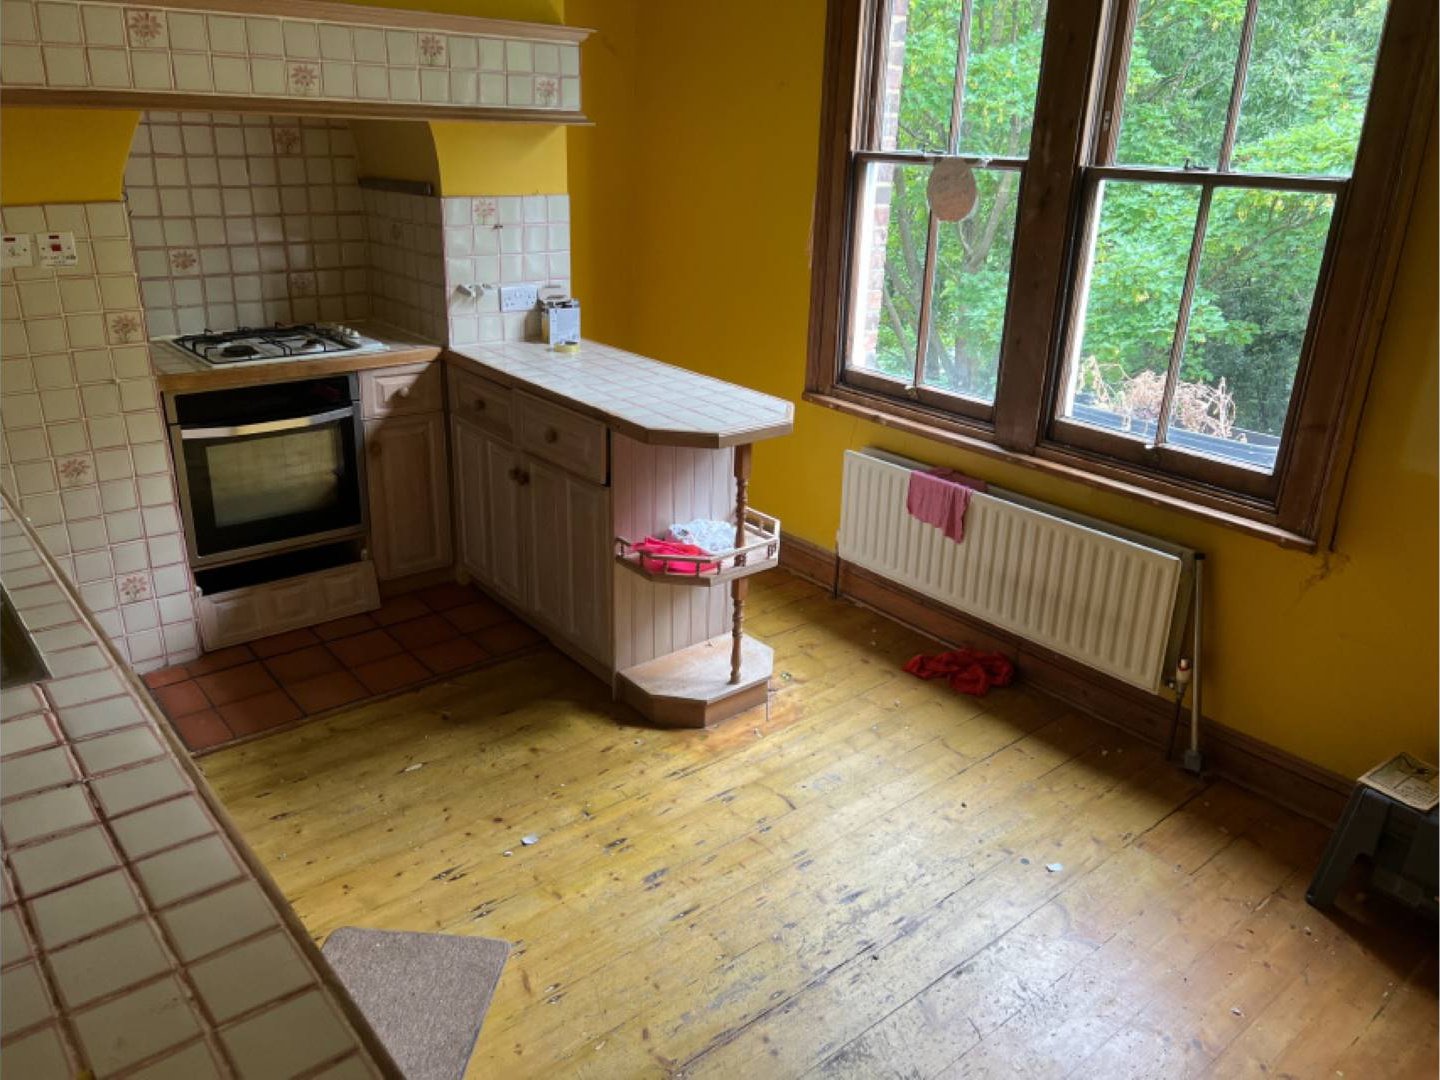
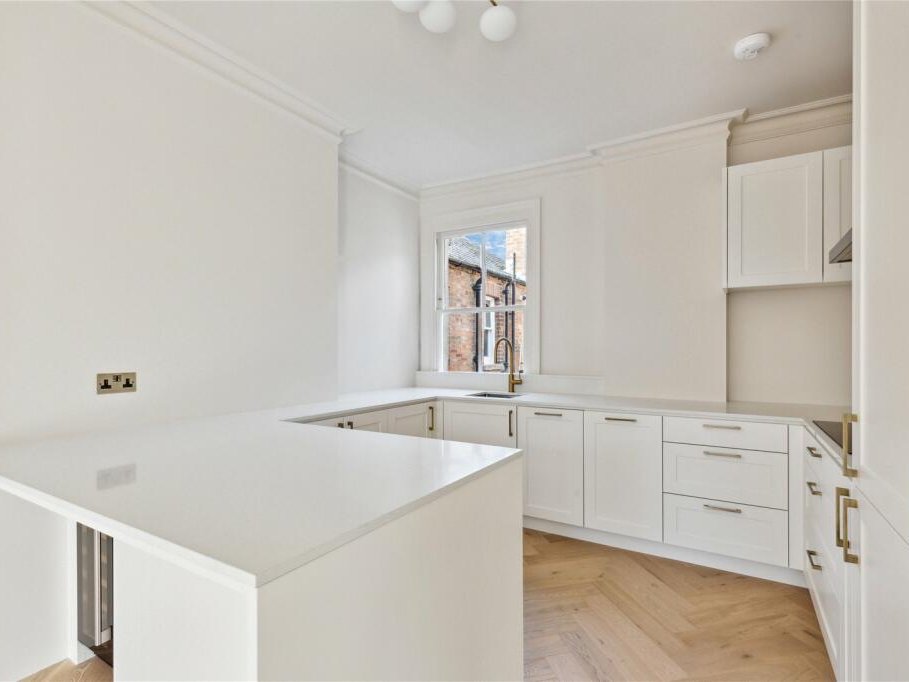
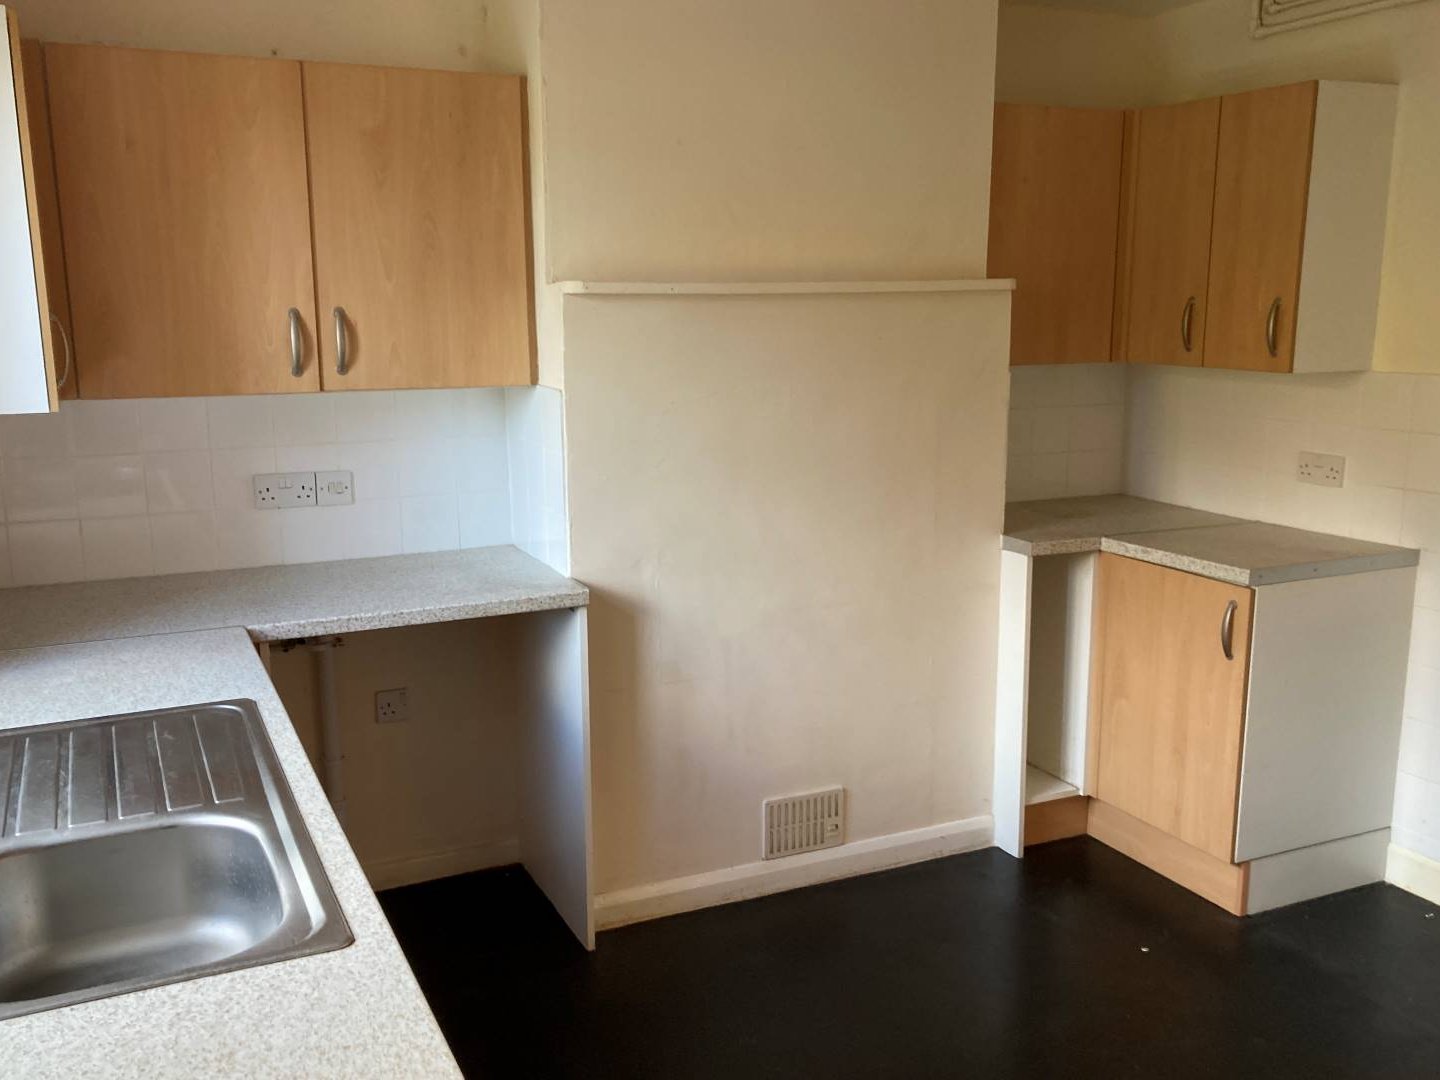
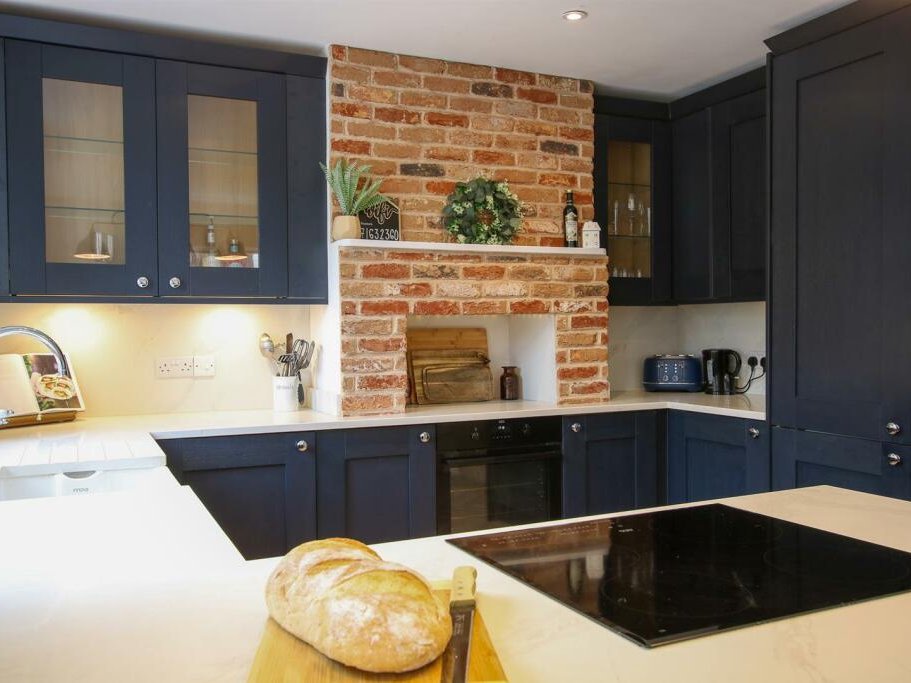
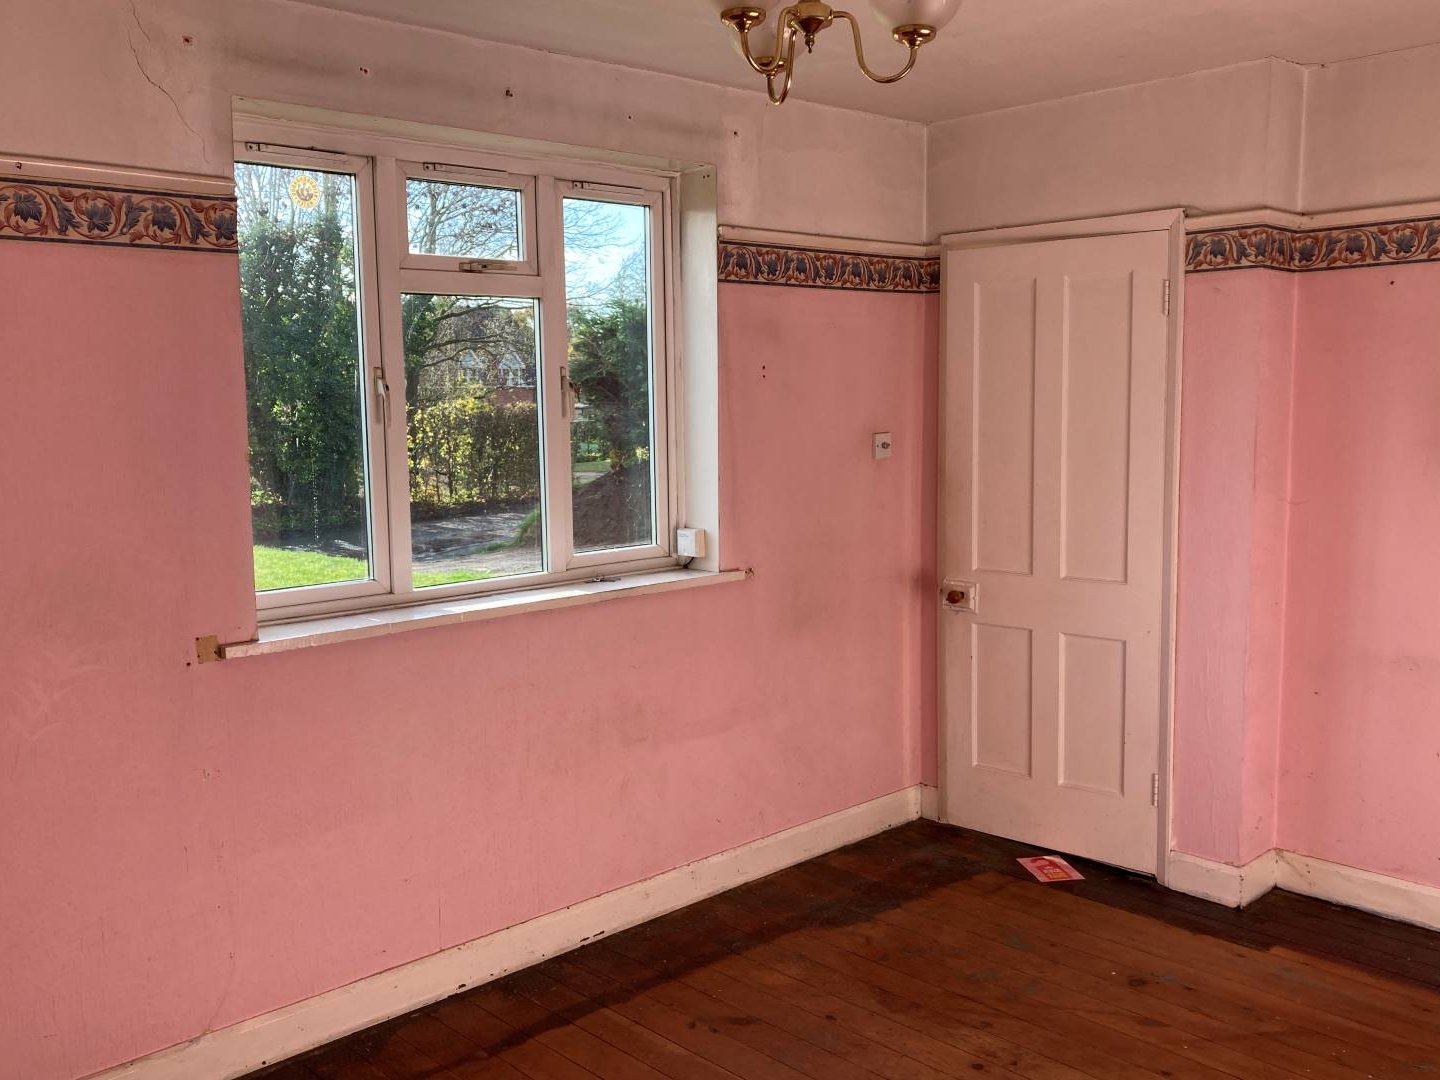
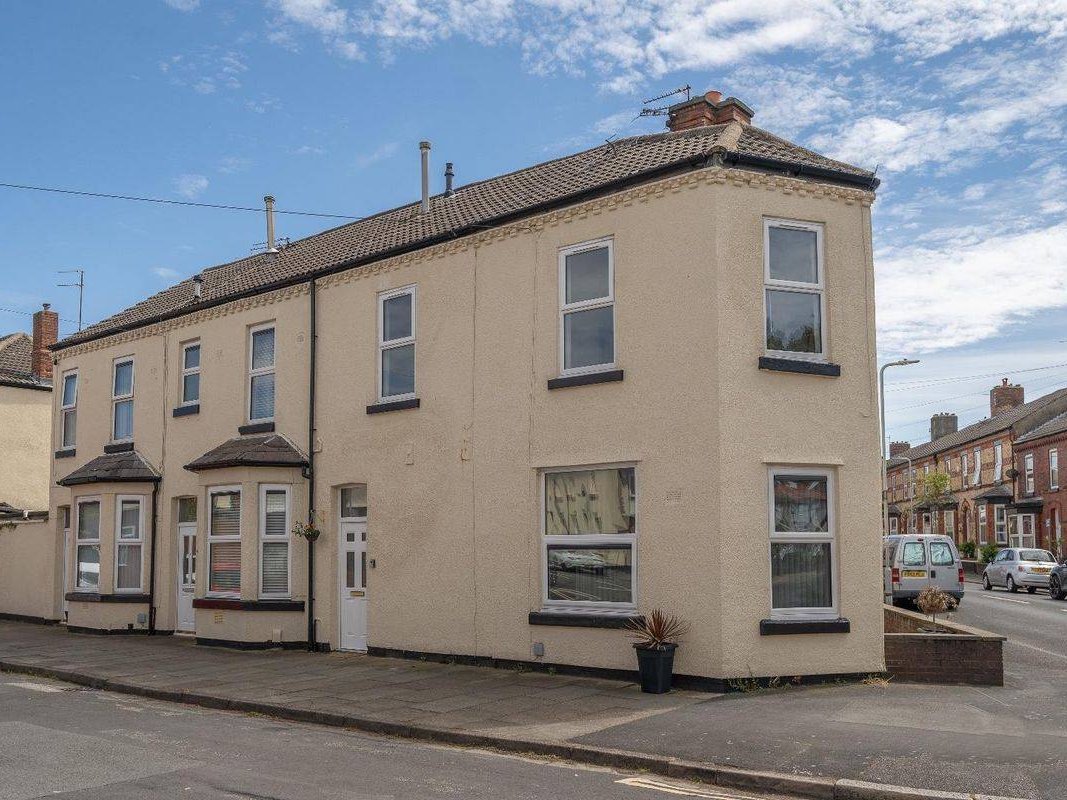
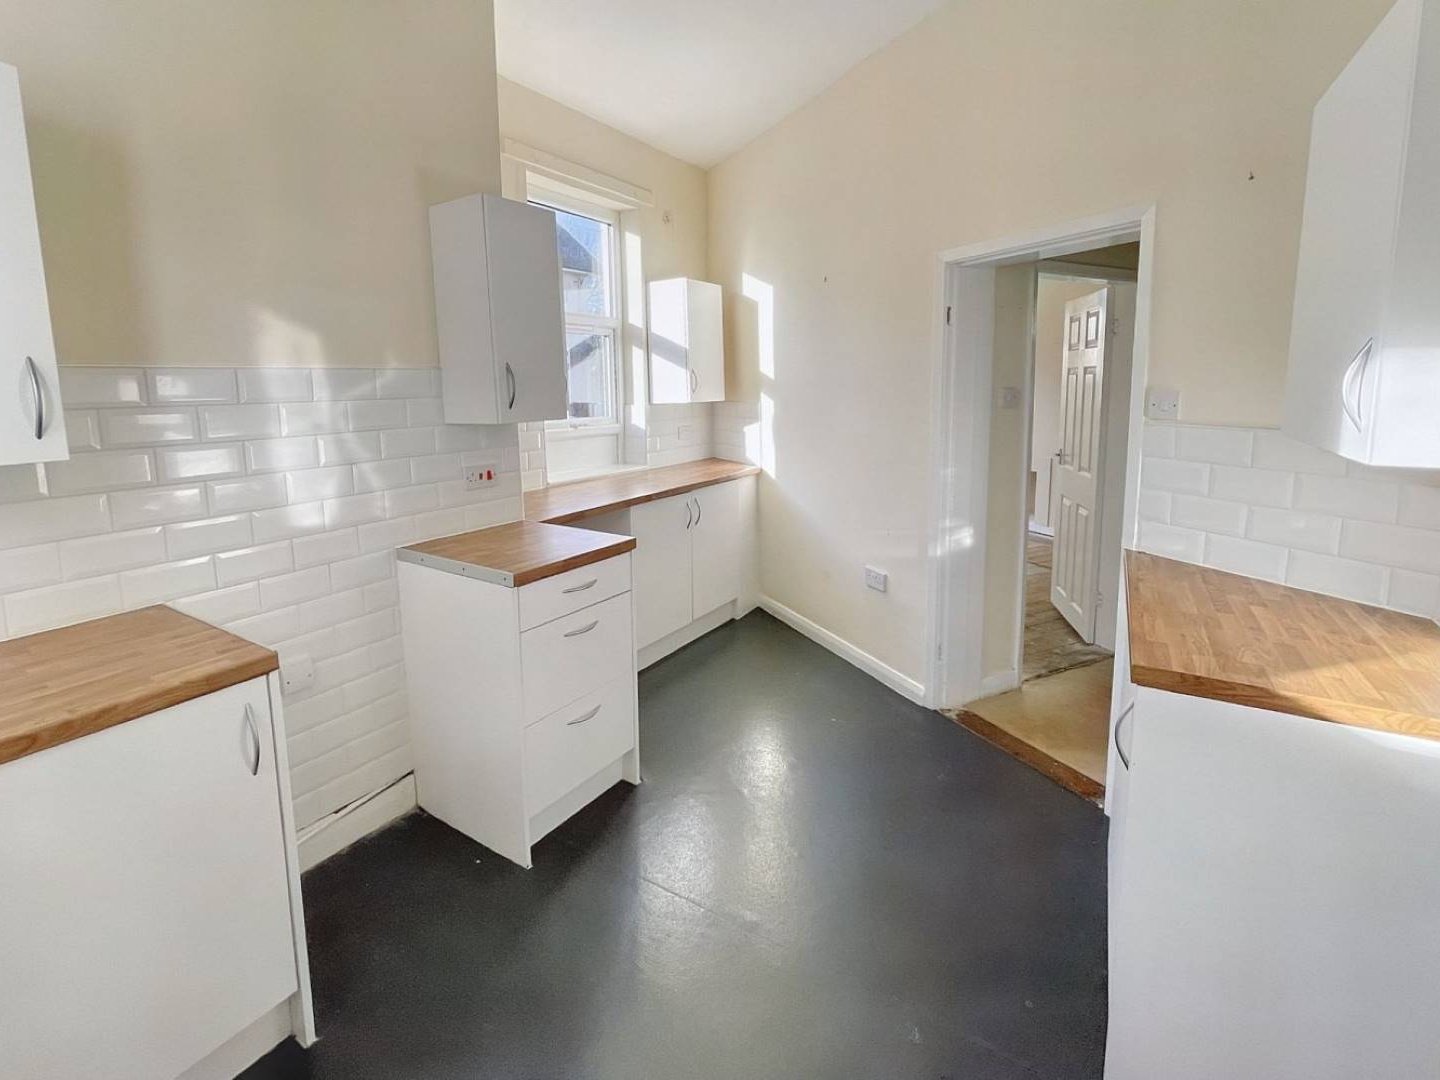
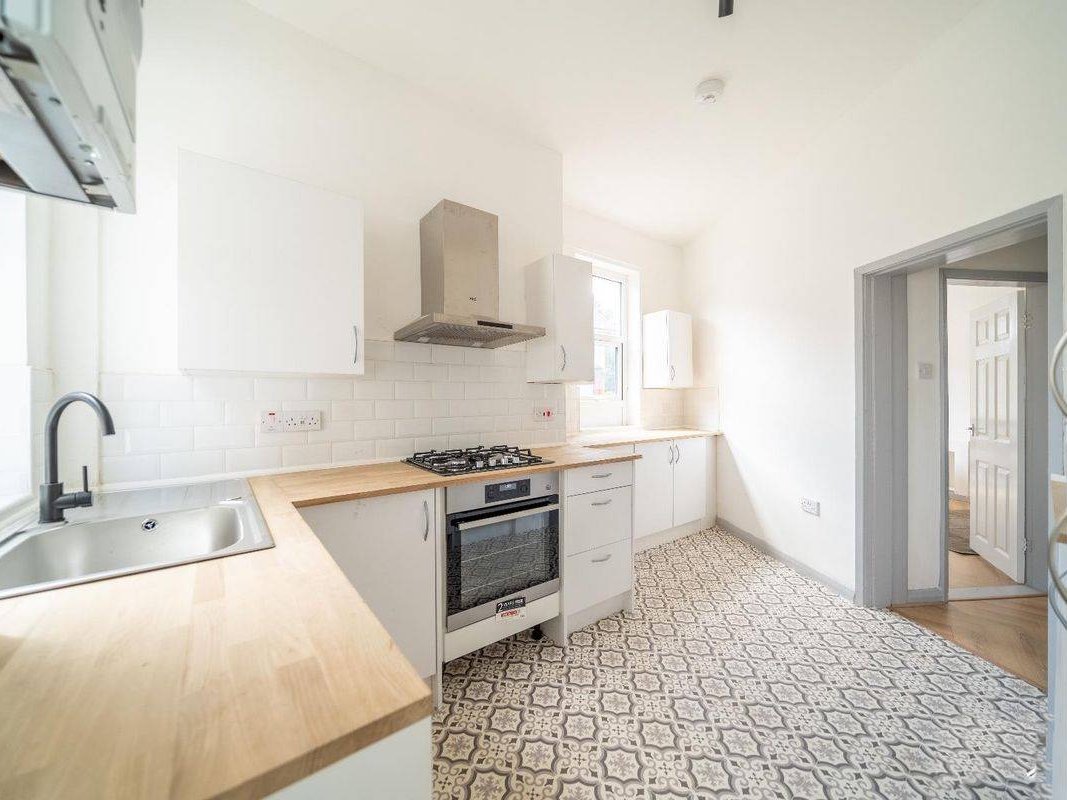
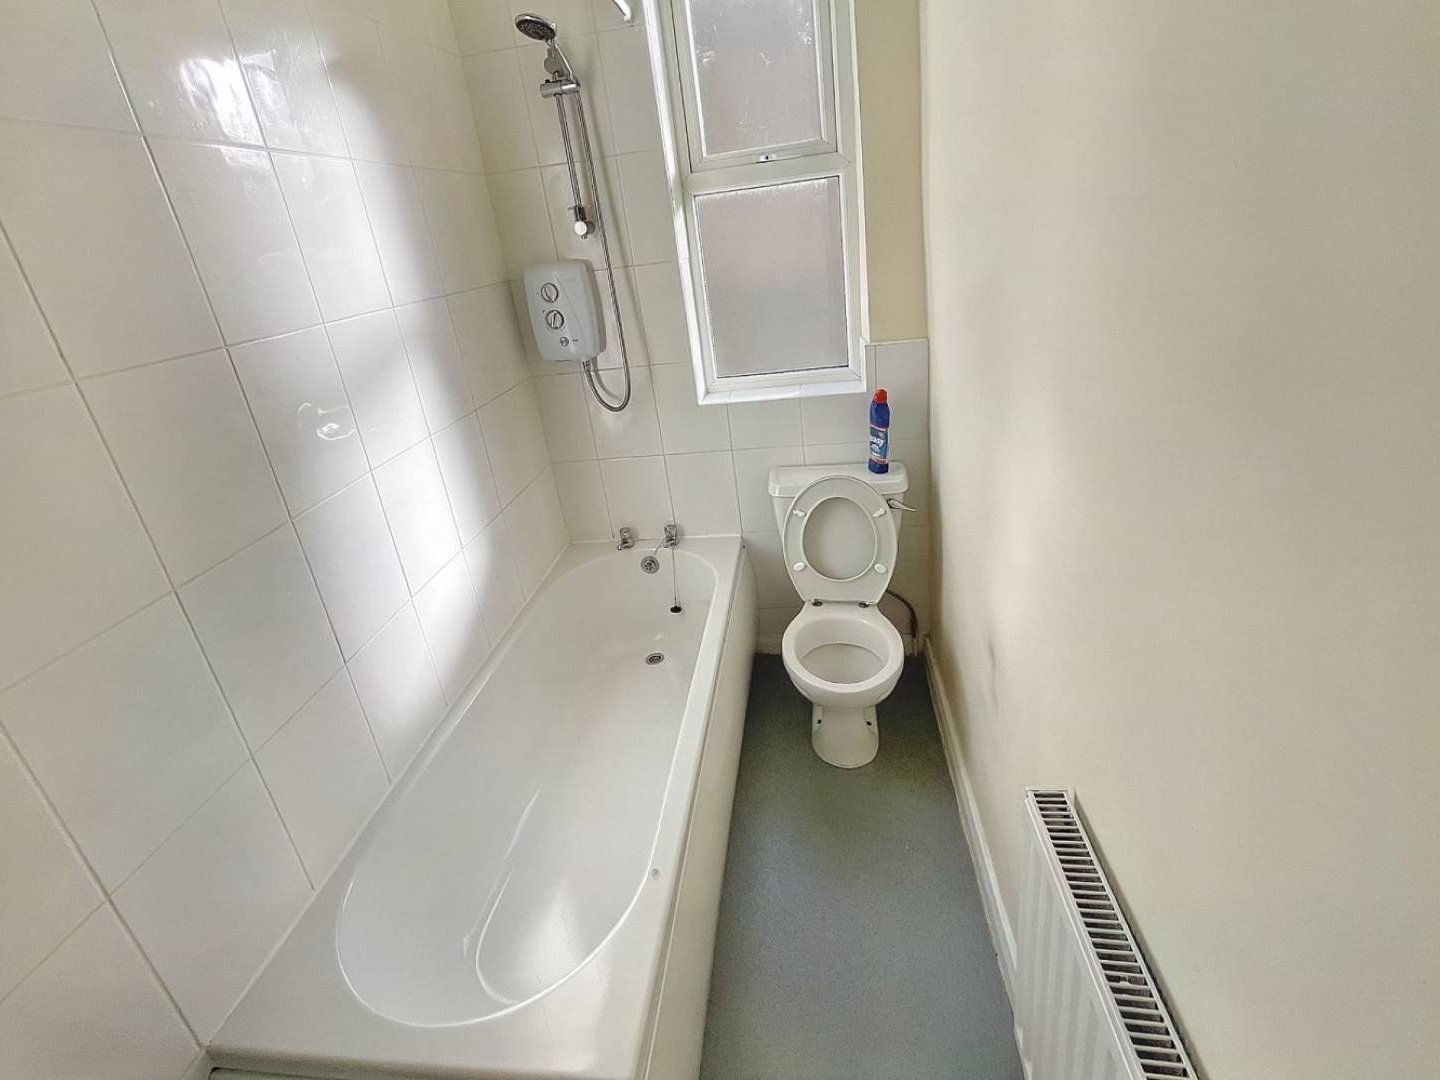
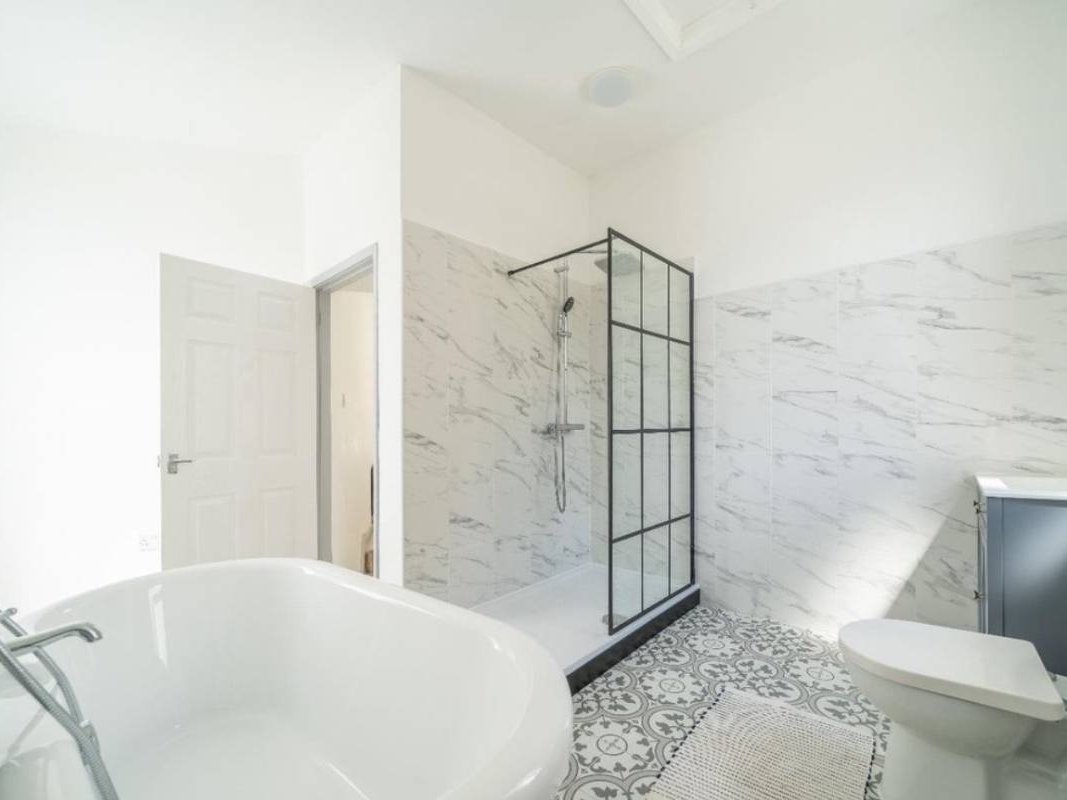
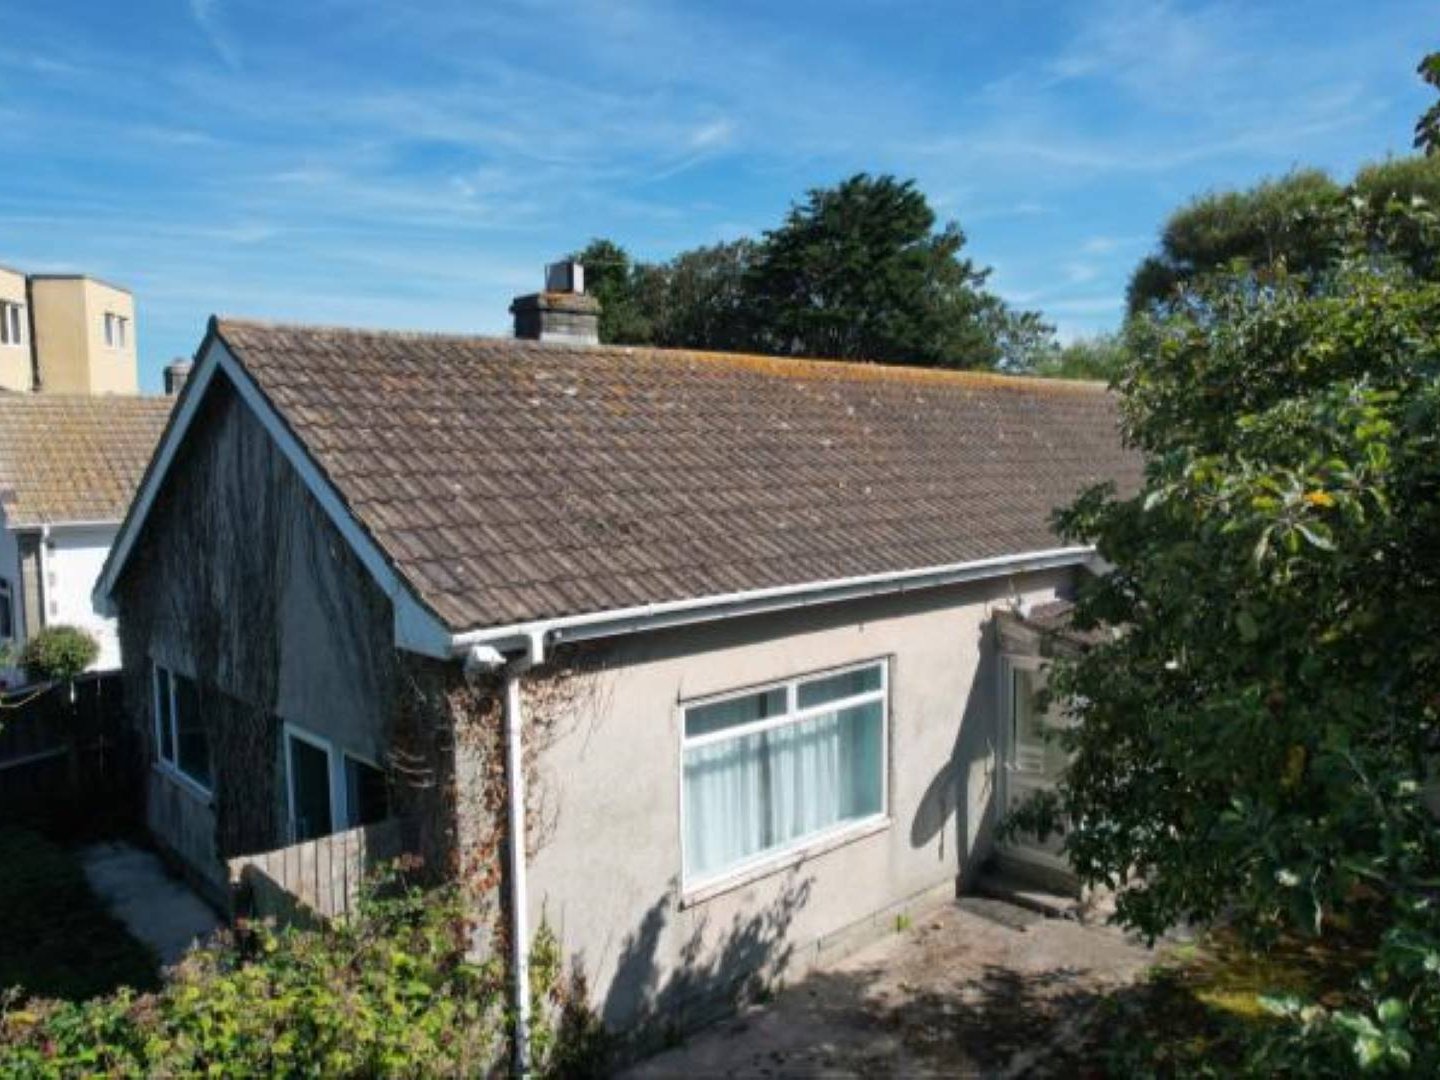
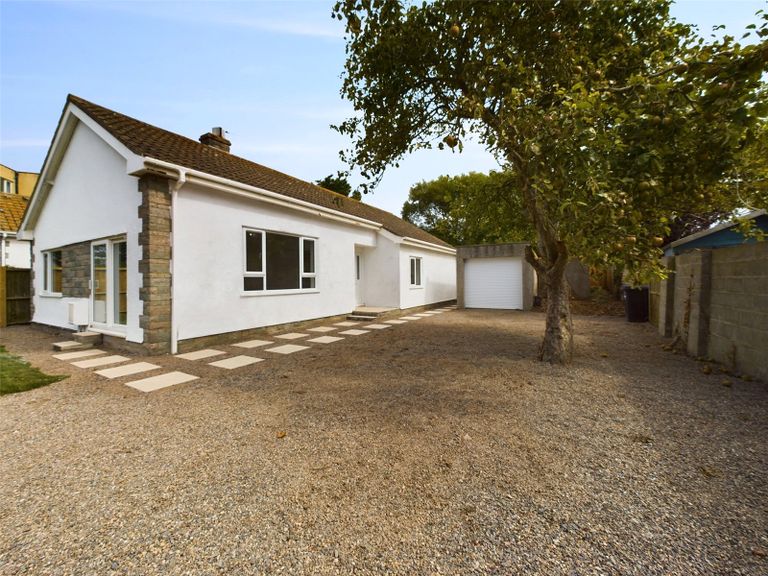
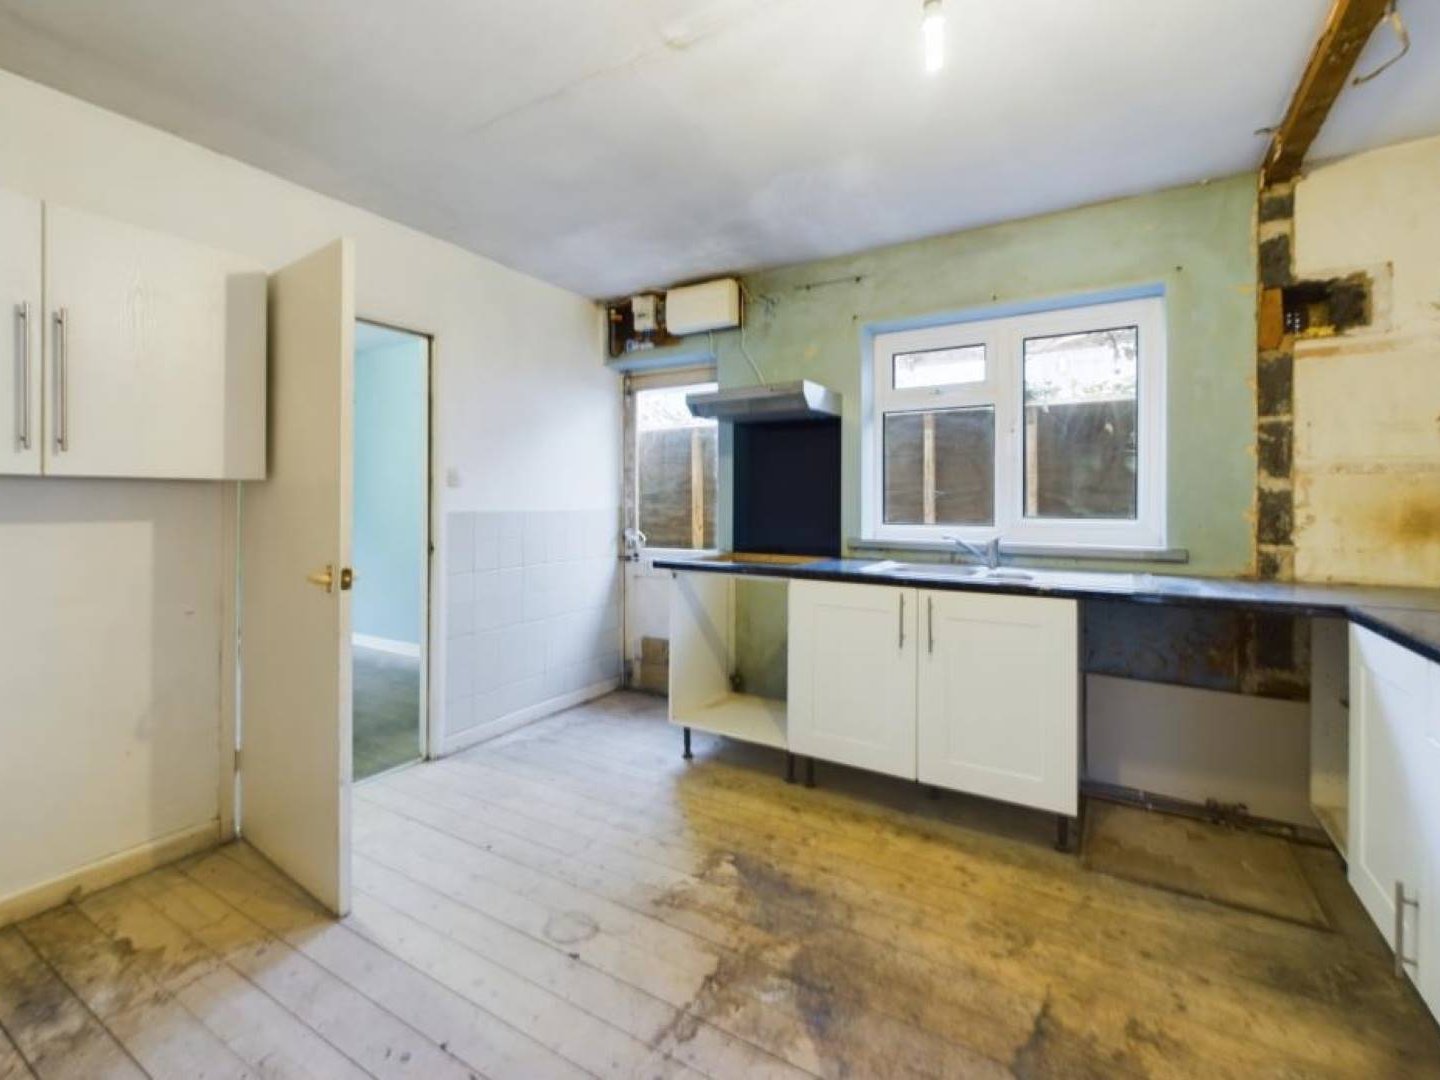
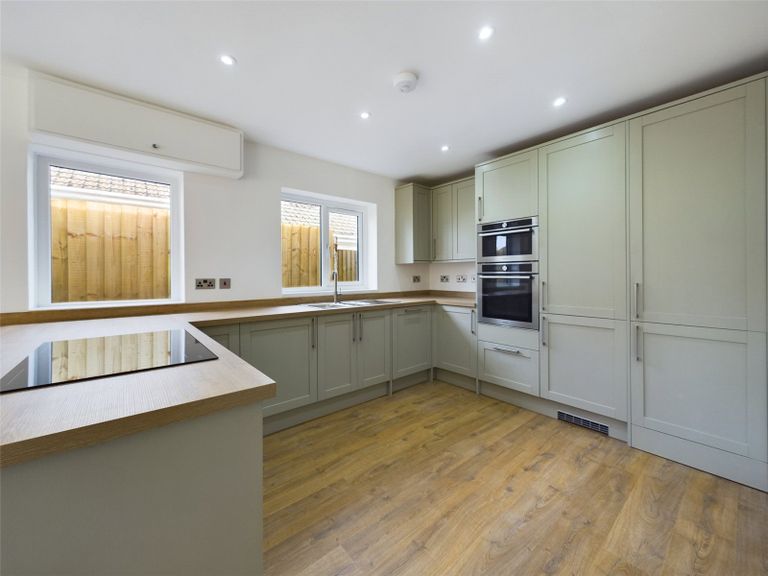
To show just how much potential unmodernised properties can offer, we've pulled together four real auction purchases that were renovated and later resold on the open market. The selection includes a flat, a terraced house, a semi-detached home and a bungalow - showcasing the variety of property types that go under the hammer.
For each case, we've shown the time between auction and resale, along with the uplift in sale price. All four saw significant renovations and resale uplifts ranging from 40% to 70%, highlighting the strong returns that can be achieved through well-executed improvements. Together, they give a clear picture of the types of opportunities the auction market can offer
| Auction Sale Price | Resale Price | Time | Price Difference |
|---|---|---|---|
| £550,000 | £789,000 | 1 year, 4 months | £239,000 |
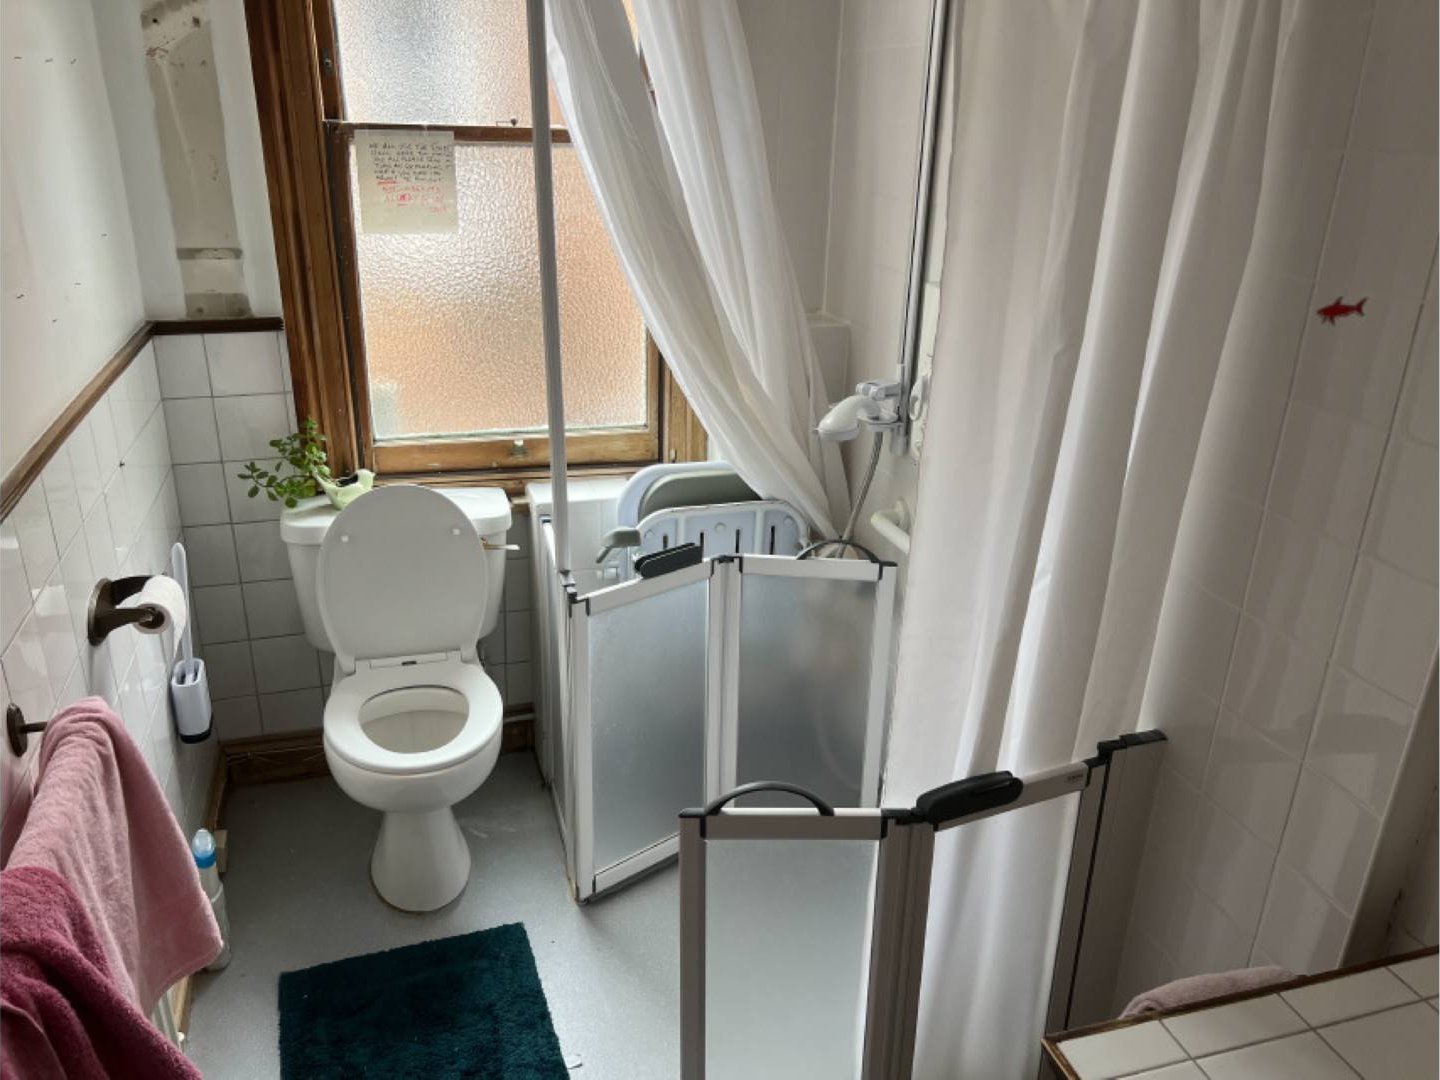
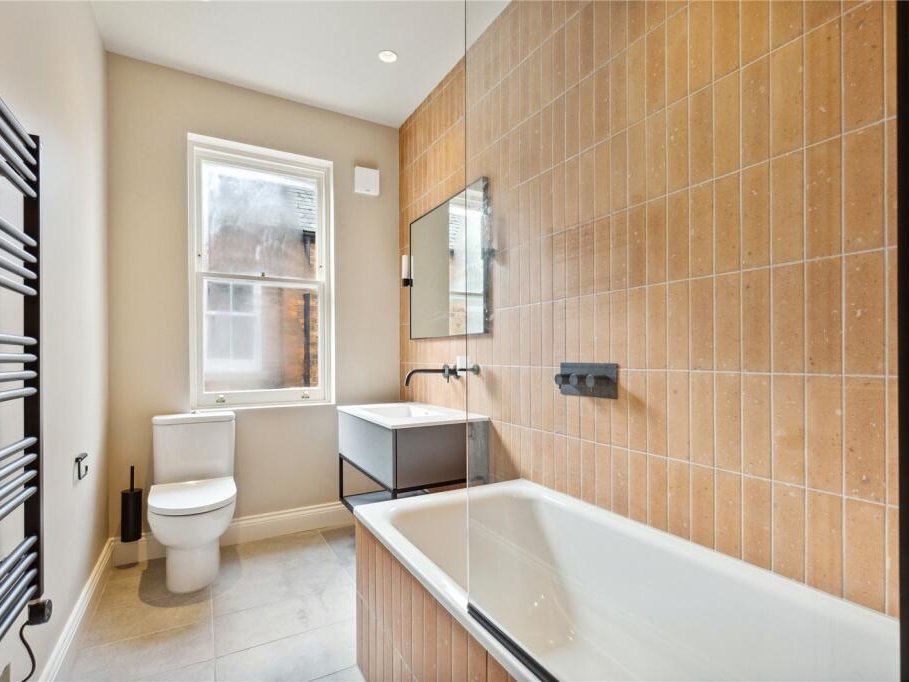
| Auction Sale Price | Resale Price | Time | Price Difference |
|---|---|---|---|
| £175,000 | £297,000 | 1 year, 5 months | £122,000 |
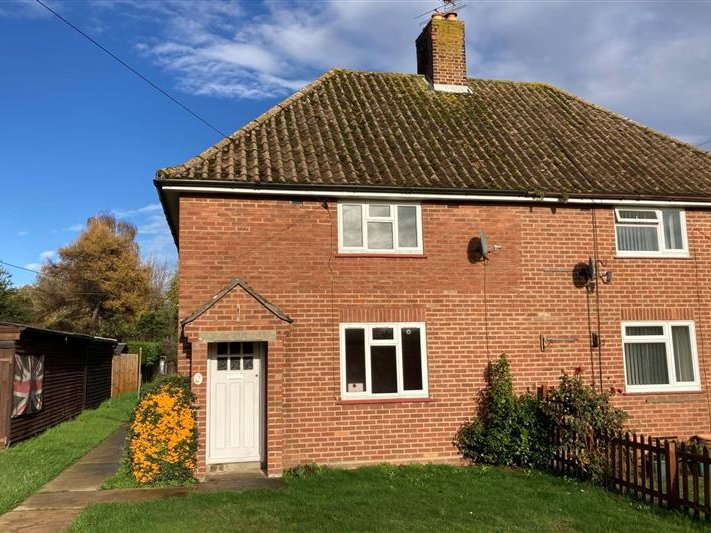
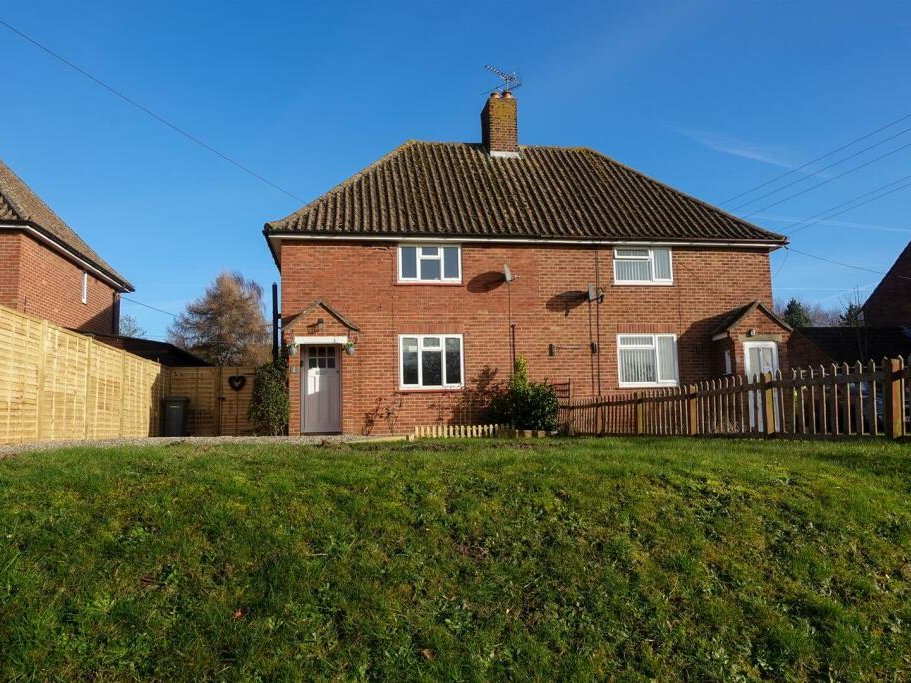

| Auction Sale Price | Resale Price | Time | Price Difference |
|---|---|---|---|
| £137,000 | £230,000 | 10 months | £93,000 |

| Auction Sale Price | Resale Price | Time | Price Difference |
|---|---|---|---|
| £275,000 | £435,000 | 6 months | £160,000 |
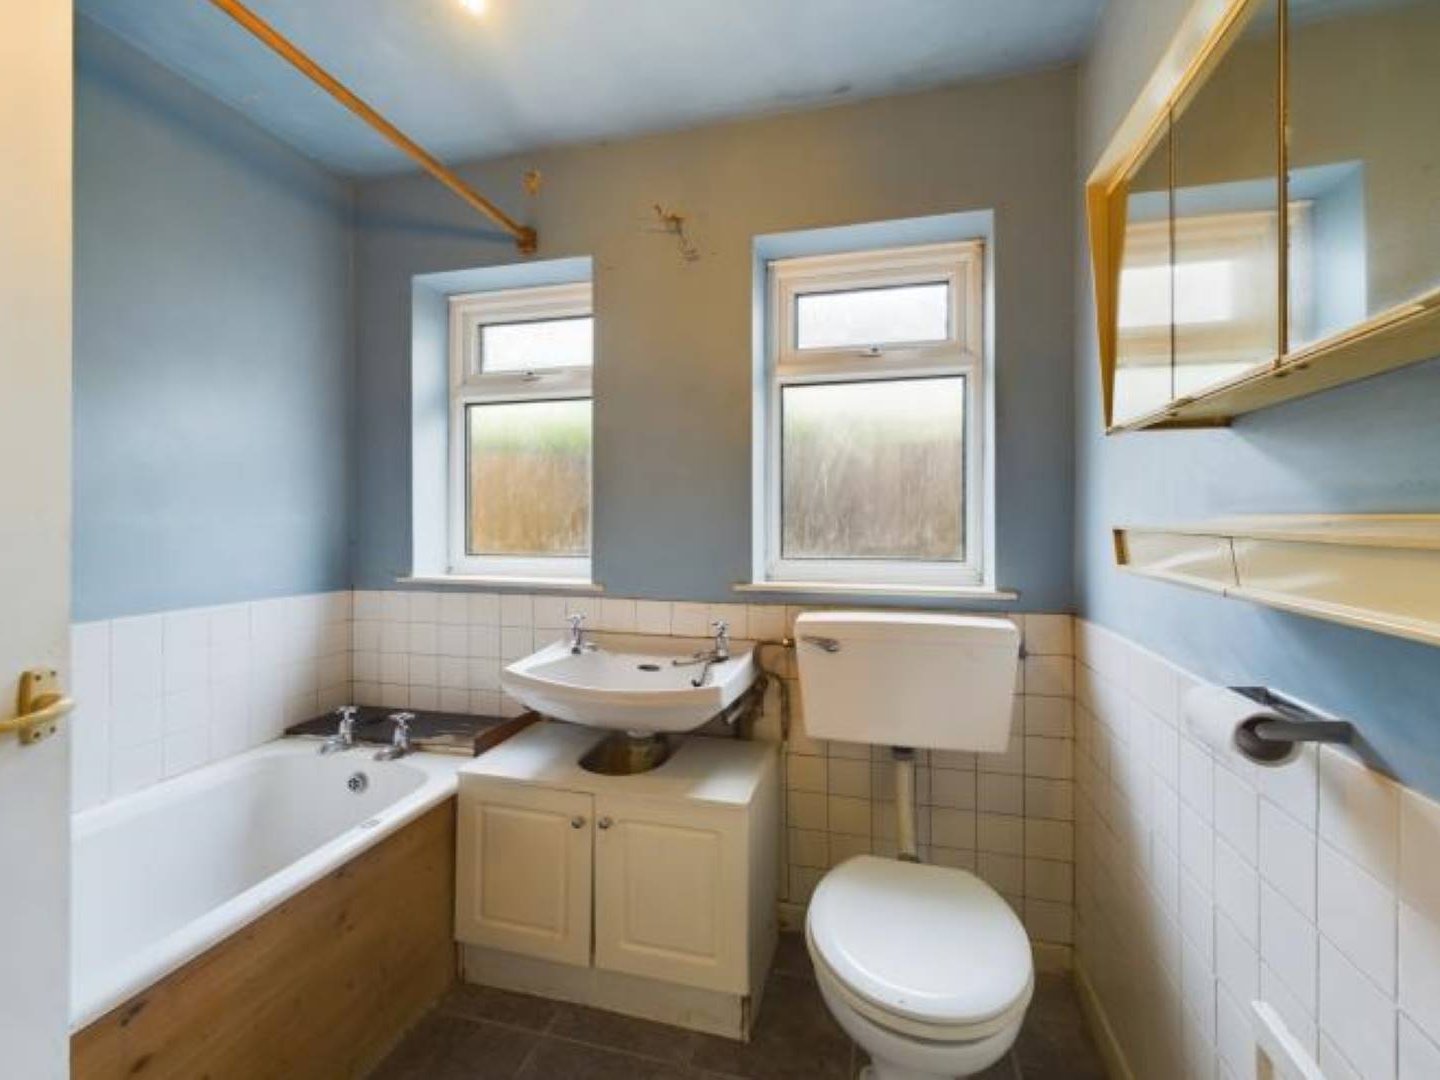
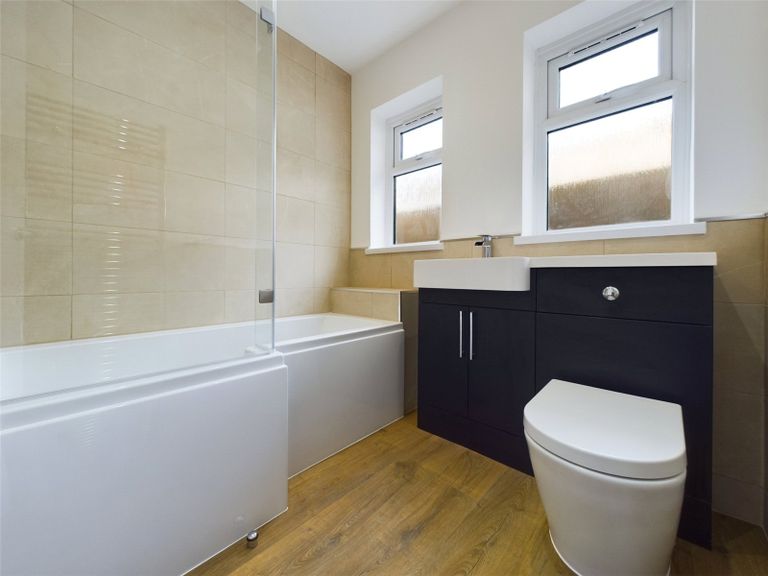
Slide to reveal
Regional Analysis
Regional trends provide further clarity on the rise of unmodernised properties, highlighting hotspots where buyers are actively seeking renovation opportunities. Some regions have seen surging demand for unmodernised homes, particularly in areas where properties are more affordable and present strong value-add potential. Understanding these regional differences is key for buyers targeting specific markets and for sellers looking to optimise their auction strategy.
As the auction market evolves, unmodernised properties remain a prominent feature, offering buyers significant potential for capital appreciation. With 2024 marking a record year for these properties, investors and homebuyers alike continue to seek out opportunities to maximise value in a dynamic marketplace.
London
Residential
2023-2024
Regional Data
Every quarter we will be including regional data from the past five years, including the number of lots sold and the average sale price, and now average yield too. This allows you to track what is happening across the country, to spot trends, and see how changes in the wider market may be affecting auctions.
The data in these charts consist of all auction sales on a quarterly basis, including individual single lot sales.
Data for all unconditional auction sales.
Data for all unconditional auction sales where there is an income.
London
South East Home Counties
South West
Yorkshire & The Humber
North West
North East
West Midlands
East Midlands
East Anglia
Scotland
Wales
North West Home Counties
Northern Ireland
Regional Data Analysis
As with any part of the property market, auction activity doesn't happen in a vacuum. Broader economic factors can all impact both volume and pricing at auction. What we often see is that these changes show up in auction data before they're reflected in the wider market, making it a useful early indicator for spotting emerging trends. Tracking this data over time gives a valuable view of how different parts of the country respond to market pressures, and where opportunities may be emerging.
Closing Summary
Reflecting on 2024, the auction market has once again proven its ability to adapt to changing economic and regulatory pressures while maintaining strong investor confidence. The steady rise in sales volumes, coupled with increasing average sale prices and growing interest in unmodernised properties, underscores the continued appeal of auctions as a dynamic and accessible marketplace.
As we move into 2025, the key drivers of auction activity - interest rates, rental market dynamics, and evolving legislation - will continue to shape investor behaviour. With buyers seeking value-add opportunities and sellers leveraging auctions for quick, efficient transactions, the sector remains well-positioned for another active year.
Staying informed on market shifts and emerging trends will be essential for those looking to capitalise on opportunities in the ever-evolving property auction landscape.

If there are any topics you would like us to focus on in future releases, or you have any feedback or thoughts you would like to share, please contact us on insights@eigroup.co.uk.
PS. Our next edition will be released in June 2025, so if you are not already on our newsletter mailing list, sign up today!
Disclaimer: The figures in this newsletter are based on sales data provided to us by the auctioneers.
