
Property Auction Insights
March 2023
Since 2006 we have released a monthly newsletter which details the insights from the previous month's auction sales across the country. This data includes information at a national level as well as by region, also splitting down by residential and commercial property types. However, with the data we collate from across the property auction industry, we knew we could carry out deep-dive analysis to help provide an even greater understanding as to what is really happening in the property market.
We will be releasing a new report every quarter, providing the latest stats by region, as well as including an in-depth focus piece for you to delve further into the world of property auctions. This edition, we are focusing on property yields, with over 20,000 sold properties from the past five years being examined and leading to some very interesting discoveries.
Focus on: 2022 | A Year in Review
2022 was a booming year across the entire property industry, with house prices soaring and agents run off their feet by determined buyers-to-be. This is echoed across the auction industry, with the number of lots sold and total raised growing on the 2021 figures for the first three quarters of the year.
However, with political and economic turmoil came rises in the Bank of England base rate, which in turn had a knock-on effect on mortgage interest rates and other funding channels. Combined with the added energy increases and the cost-of-living crisis, the number of ready and able buyers slowly started to decrease.
Buyers began tightening their purse strings, lowering new offers or gazundering existing ones, while also trying to complete on sales before any finance offers at previous rates expired. Luckily, the auctions market was quick to respond, with sales staying strong until the end of the year, and the total raised managing to exceed 2021 figures until December.
28,514
Lots Sold
£5,807m
Total Raised
We are already beginning to see interesting figures for 2023, with a rapid increase in the number of properties going through auction, in particular residential lots. You will have hopefully seen this in our most recent monthly newsletter, but if not, we would recommend you take a look.
Annual Comparison 2021 to 2022
The data shown in the graphs below includes all sales from 2022, including individual online auctions and conditional sales. Note the dip for January and August, which is common due to a lower number of auctions taking place during the month.
Lots Sold
Total Raised
Focus on: Property Yields into 2023
We chose to focus this edition on yields, as tenanted properties accounted for 18.2% of all lots sold by auction in 2022. Property investors looking at those lots which are already generating an income can be an easy addition to a portfolio, but it is important to calculate the potential yield based on your maximum bid to ensure that the deal remains a good one. We will be focusing on gross yields (income divided by sale price), rather than net yield, however it is important to factor in stamp duty and all fees when assessing a potential purchase.
We have split our data analysis by region and by property type. We have done this to allow you to compare your own potential deals against the averages seen in the market over the past five years.
Yield by Region
The data shows that several regions have been able to hold their average yield steady over the past five years, with only very mild changes. These include London, Home Counties, East Anglia, North East, South West and East Midlands. North West had a strong peak in 2020, but it has now levelled off to pre-Covid levels. Northern Ireland has seen a decrease over the past two years, but overall the numbers of tenanted properties is a relatively small sample of the total market.
Yorkshire & The Humber, Wales and West Midlands have been seeing annual fluctuations over the past 5 years; however, the average yield remains strong. Scotland is the standout region, with average yield soaring to 16-17% over the past two years, assisted by the drop in average sale price, however we'll be closely watching to see how the new legislation (Cost of Living (Tenant Protection) (Scotland) Act 2022) effects the region in 2023.
Comparing the regions yields against their average sale price flags up some interesting points. We would expect to see when average sale prices increase that yields should start to decrease, and vice versa. However, in several regions, we've actually seen a decrease in yield and also in average sale price. This could be down to numerous aspects, including the economic climate and cost of living in that region. The regions we see this happening in are East Midlands, Wales, South West and North East to a lower extent. Interestingly though, London has seen an increase in yield and in average sale price, which would indicate that the market has been able to adjust rent increases in line with demand.
Click areas of the map to toggle data for each region on the graph on and off.
Yield by Property Type
We have separated the data into six common property types; Flats/Apartments, Terrace Houses, Houses, HMO / Blocks, Mixed Use and Commercial. The most commonly seen tenanted property in auction is the Terrace House, accounting for 22.5% of our total sample set. Nationally, we saw average yields of 6.2% for 2022, with 2 and 3 bedroom properties seeing slightly higher yields of 6.8%. In the residential sector, Flats and Apartments remain a popular choice, with average yields of 7.7% for 2022. One bedroom properties see higher than average yields, with national figures up at 9.3%. All standard houses (whether detached or otherwise) saw an average yield of 5.15%.
Typical investment properties in the form of HMO's or Blocks have remained strong at 6.7%, and Mixed Use at 6.5% for 2022. Commercial properties have seen a slight drop overall from average yields of 9.4% to 8.5% from 2021 to 2022. In particular, retail properties dropped from average yields of 10.8% to 9.1% from 2021 to 2022. We will be covering more about commercial properties in a future PAD Report if this is of interest to you.
All properties included in this analysis were sorted into their primary investment type. This means for example that terrace houses only appear in the Terrace House category and do not appear in the House category. Houses that were advertised as multiple occupancy or are split into self-contained abodes are marked as HMO / Blocks. Commercial properties are those without any residential aspect listed.
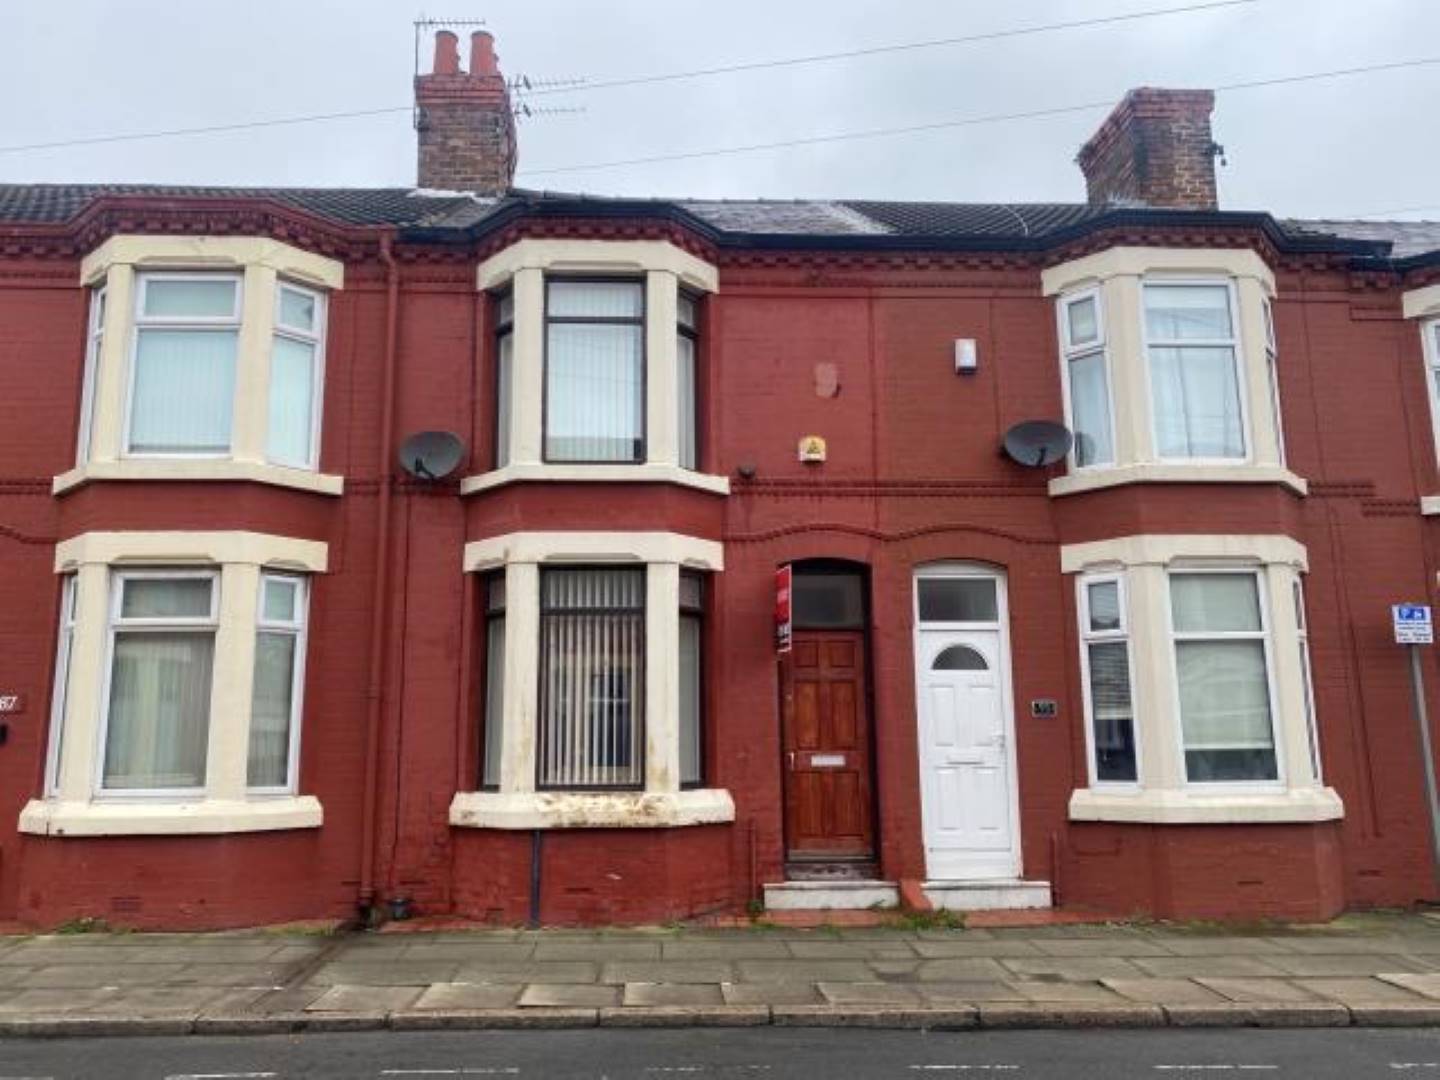
Example Properties
Below is a selection of properties sold during 2022 that formed part of our analysed data, to show real examples of actual sales and gross yields achieved.


Regional Data
Every quarter we will be including regional data from the past five years, including the number of lots sold and the average sale price. This allows you to track what is happening across the country, to spot trends, and see how changes in the wider market may be affecting auctions.
London
South East Home Counties
South West
Yorkshire & The Humber
North West
North East
West Midlands
East Midlands
East Anglia
Scotland
Wales
North West Home Counties
Northern Ireland
Regional Data Analysis
The data in these charts consist of all auction sales on a quarterly basis, including individual single lot sales, as well as conditional sales.
Interestingly, the effect of Covid on the auctions market during 2020 can clearly be identified in each region in terms of the drop in lots sold during Q2. Also, nearly all regions saw a decrease in average sales value during Q4 2022, due to the change in economic conditions affecting the housing market.
Closing Summary
Yields has proven to be an appropriate topic to cover, especially as we have seen a surge in tenanted stock coming to market during Q1 2023. Some landlords are choosing to sell up due to the perfect storm going on around them; capital gains reductions, high taxations being imposed, pending changes to the EPC requirements for rentals, on top of the interest rate rises effecting mortgage rates, the cost-of-living crisis affecting tenants and potentially leading to empty properties, plus the increasing cost involved for repairs and maintenance too.
Are there still opportunities for investment which could deliver strong yields and returns?

I hope you enjoyed the first edition of the Property Auction Insights Report and it has given you some new insights to consider. If there are any topics you would like us to focus on in future releases, or you have any feedback or thoughts you would like to share, please contact us on insights@eigroup.co.uk.
I will certainly be watching to see what happens next...
David Leary
PS. Our next edition will be released in June 2023, so if you are not already on our newsletter mailing list, sign up today!
Disclaimer: The figures in this newsletter are based on sales data provided to us by the auctioneers.